QOF data is sourced from NHS England via PracticeConnect. National £/point rate: £227.95 — Average list size: 10349.00. Figures are illustrative maximum income estimates only.
Select a Practice
Search by practice name or ODS code to see CPI-adjusted income estimates for your practice. Leave blank to view national reference data only.
Search for a practice above to see CPI-adjusted income estimates, domain breakdowns, and per-indicator figures.
What's Changed in 2026/27
Maximum income ceiling updated across all indicators
Secondary-prevention BP income now modelled under the cardiovascular disease domain
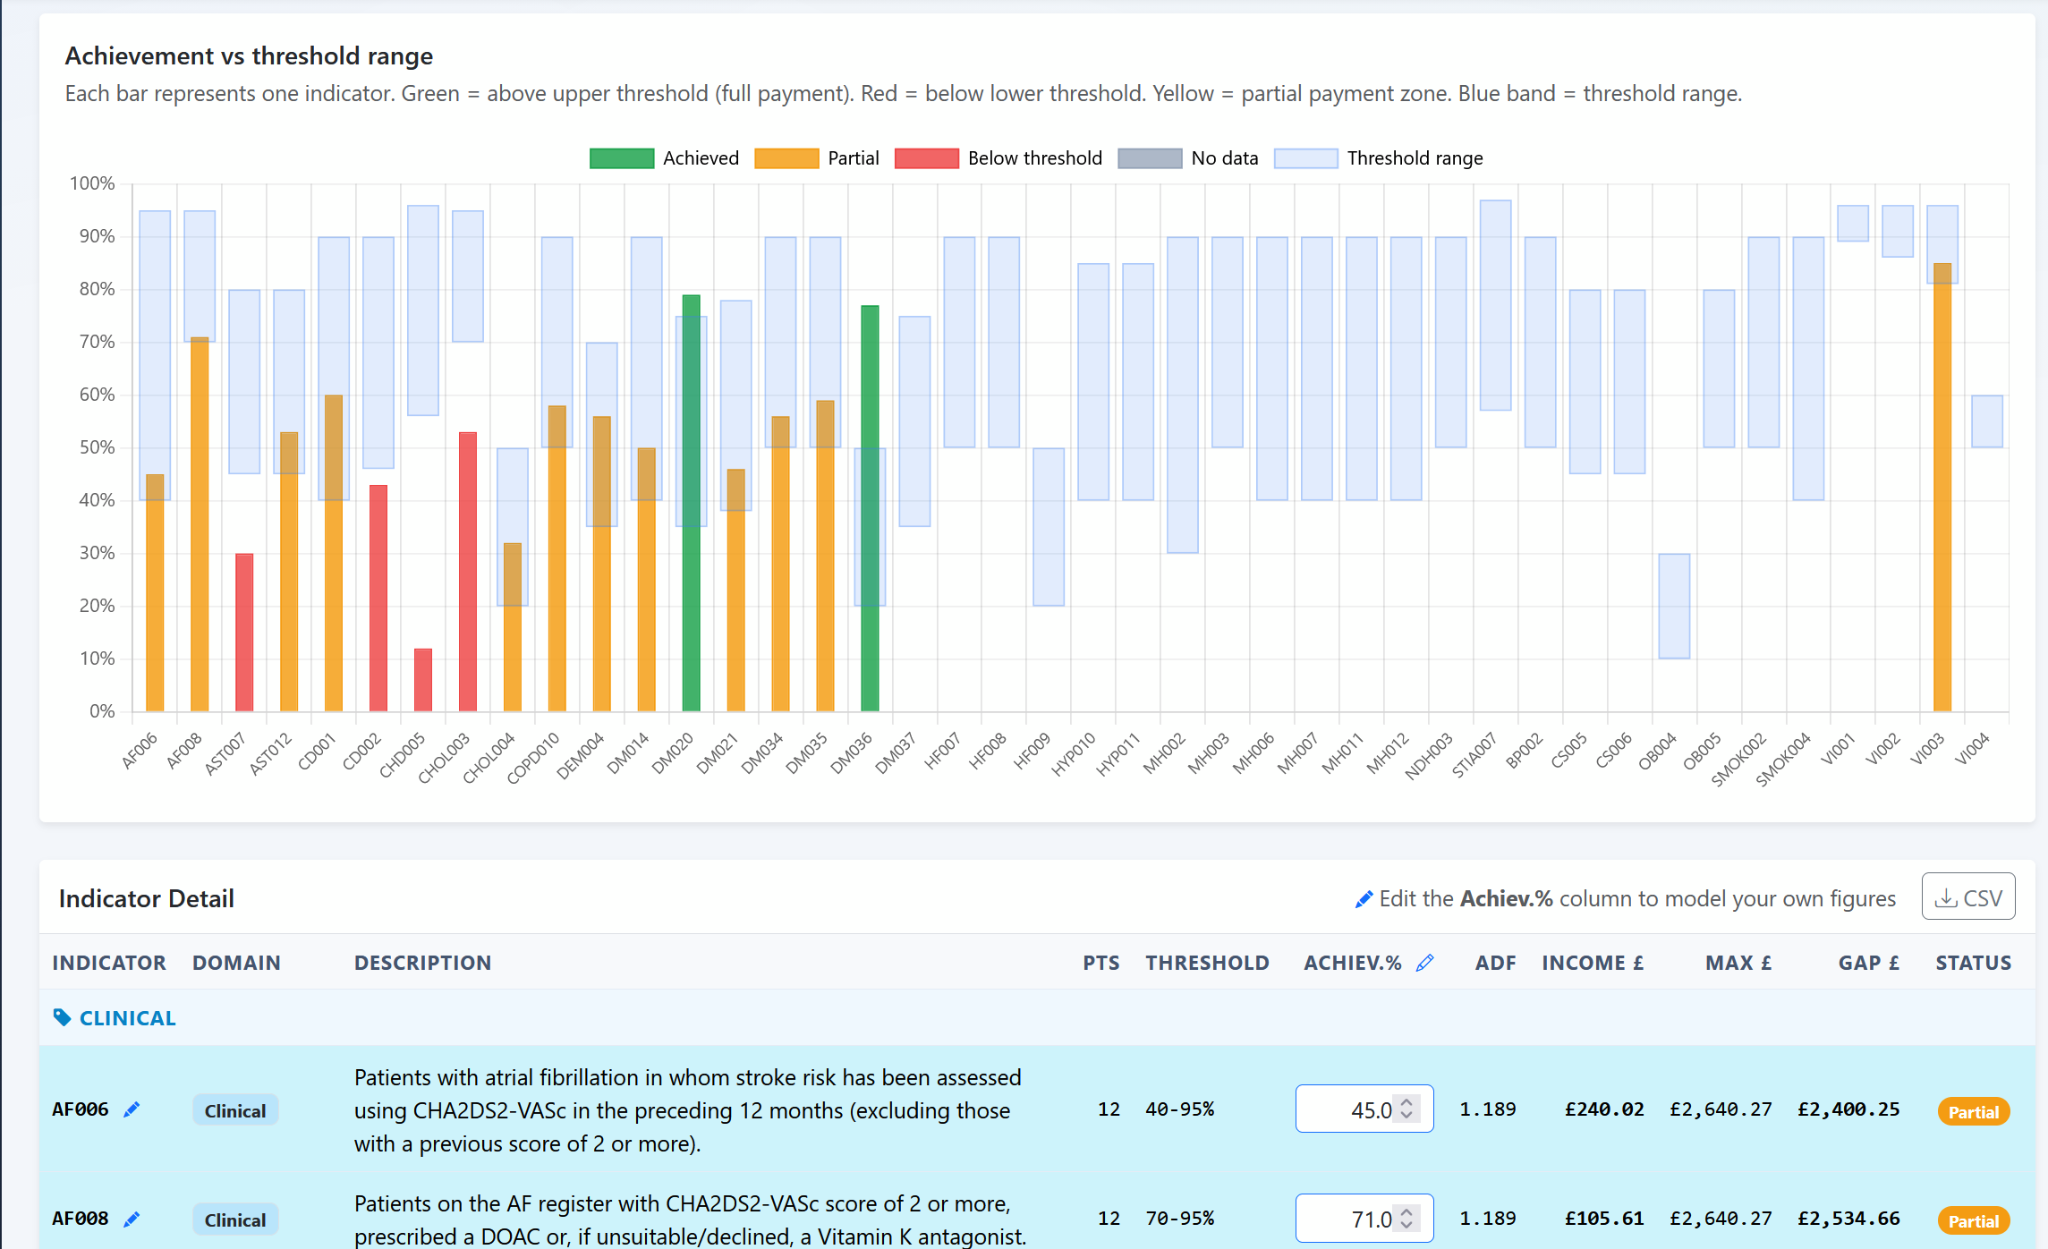
All four appear in the indicator table with full income and threshold modelling
Point totals and maximum income figures updated to reflect revised weightings
Threshold column shows both payment routes; income is modelled on the standard route
Indicator code and description updated; income modelled under the revised register definition
How QOF Income is Calculated
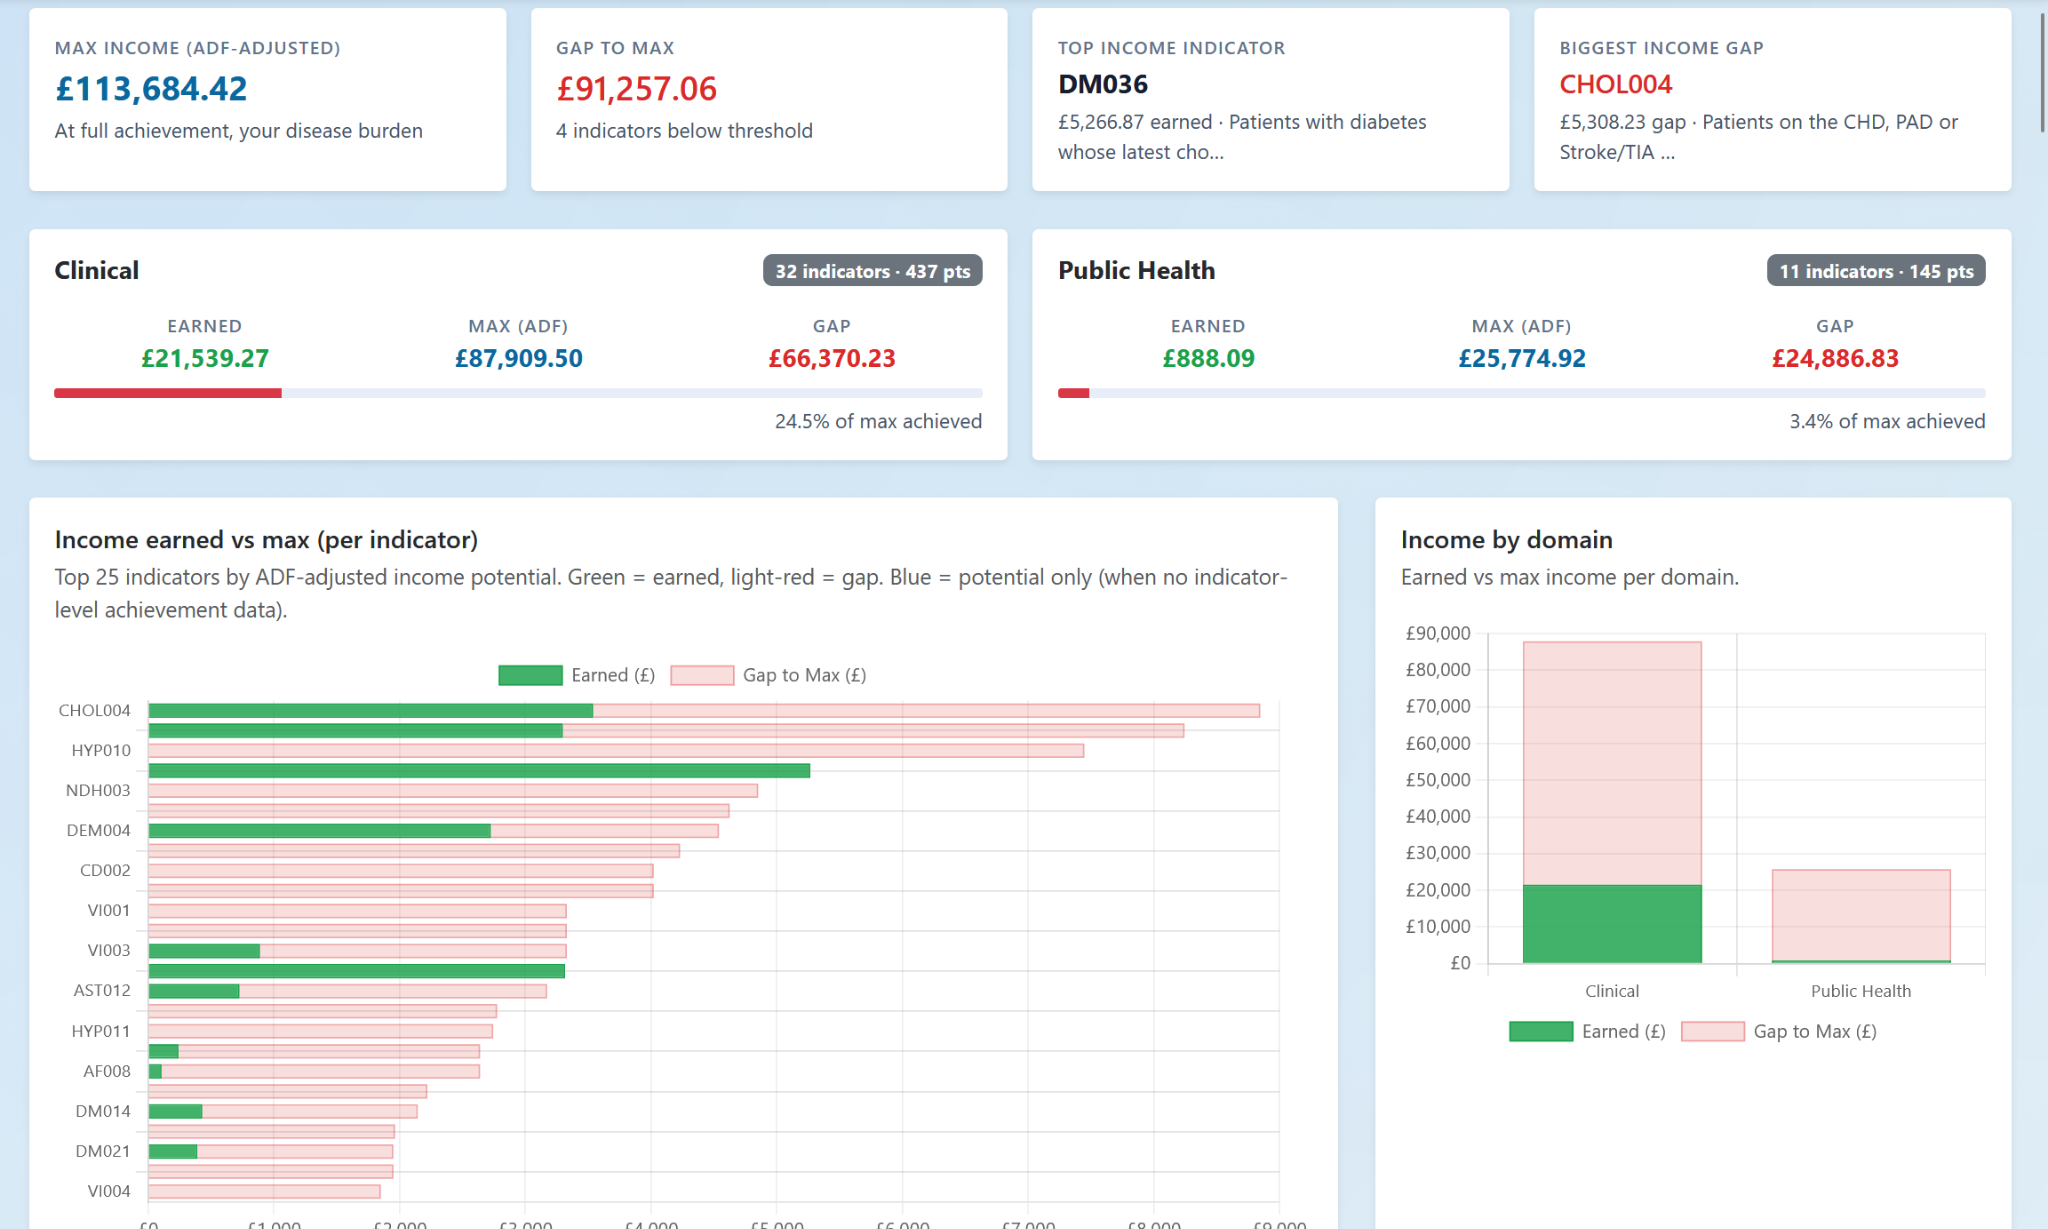
QOF income for each indicator is calculated using three inputs: the national £/point value set by NHS England, your practice's registered list size relative to the national average (the CPI), and — where prevalence data is available — an Adjusted Disease Factor (ADF) that accounts for the local disease burden.
£/Point (National Rate)
The national unit value per QOF point, set annually by NHS England. For 2026/27 this is £227.95. It is based on a notional average practice with 10349.00 patients.
CPI (Contractor Population Index)
A size-adjustment factor: your practice list size divided by the national average (10349.00). A CPI above 1.0 means your practice is larger than average and receives proportionally more; below 1.0 means smaller.
ADF (Adjusted Disease Factor)
An optional prevalence adjustment. Where local disease prevalence is higher than the national average, the ADF exceeds 1.0, increasing the effective income. Not all indicators have ADF data — those without fall back to the CPI-only figure.
Thresholds and achievement rates are not modelled here — these figures represent the theoretical maximum assuming full achievement of every indicator.
See the Full Picture on PracticeConnect
PracticeConnect gives you a live QOF dashboard with actual achievement tracking, exception rates, and detailed indicator drill-downs — updated directly from CQRS data.